
Patient Dynamics shows you monthly numbers of patients starting or stopping treatment for one or more selected drugs, allowing for detailed analysis of patient movement (i.e. patient dynamics) across, into and out of the market, and highlighting trends of interest.
With Patient Dynamics you can:
- Get an overview of the source and loss of business over time in the market for your drug versus other drugs
- Explore the proportion of patients who start taking your drug (naive initiations, switch-in or re-initiations), or stop taking your drug (switch-out or drop-off)
- Explore demographic characteristics (i.e. age, sex, location) of patients in market or on a particular drug
- Compare or confirm your understanding of source and loss of business as a result of market conditions (e.g. new listings, off patent, lines of therapy, change in indication or guidelines)
How is this report calculated?
The Patient Dynamics report summarises the changes in patient dynamics across the market for selected drug/s (i.e what is stimulating the growth or loss of business across the market). This report shows patient dynamics by month (calendar months) in the chart and data table.
A key parameter for this report is the Definition of drop-off filter.
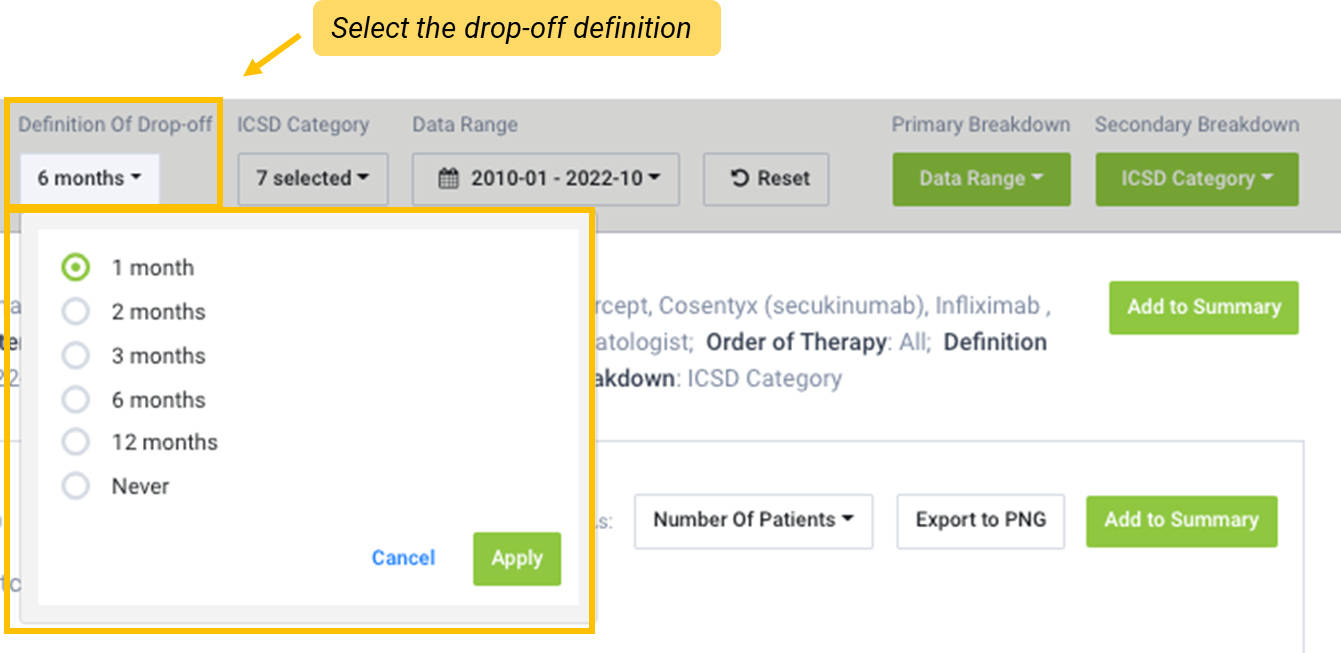
Definition of Drop-Off
A patient must have had their last script dispensed within the time period selected. If no script is dispensed for more than the number of months selected in the drop-down, they are then no longer considered to be on the selected treatment (i.e. they may have discontinued treatment or switched to another drug in the market).
The drop-off value selected will determine whether a patient is considered as having been initiated, continued, switched in/out of treatment, discontinued or dropped-off.
Selecting Never for drop-off enables you to identify naive initiations to the market (i.e. patients who initiated the selected drug as the first line therapy in the market, and have not purchased any other drug listed prior).
The following definitions are applied to the patient source and loss of business categories using a 6-month definition of drop-off as an example.
| Category | Definition |
| Source of gain | |
| Naive initiations | Patients who have initiated on the selected drug as first line therapy in the market and have never had a script dispensed for another drug in the market prior. |
| Switched in |
Patients who have previously purchased a competitor drug within the previous six months (or chosen drop-off value) and are now buying the selected drug. Note: "Switch in" also includes "Add on" (i.e. the patient might be continuing the previous treatment as well). |
|
Return to market (Delayed Switched in) |
Patients who were on treatment for a selected drug, then dropped off treatment for six months (or chosen drop-off value), before re-initiating treatment with a different drug. Note: A patient may have purchased another drug in the market, however it will have been more than six months since their last script (or the chosen drop-off value), and therefore "dropped-off" that treatment. |
| Source of loss | |
| Switched out | Patients who stopped purchasing the selected drug (i.e. have not purchased for six months (or chosen drop-off value) or longer), and have purchased a competitor drug). |
| Dropped-off | Looking forward six months (or chosen drop-off value), the patient does not make another purchase of the selected drug, and the patient has not recorded a purchase of any other drugs in the market. |
| Deceased | A patient dies within the last six months (or chosen drop-off value). If a patient dies in the months following the drop-off period, they will be considered to have "dropped-off". |
| Retained business | |
| Continuations | A patient has purchased the selected drug within the last six months (or chosen drop-off value) and is purchasing again. |
| Re-initiation |
A Patient was on treatment for a selected drug, then dropped off treatment for six months (or chosen drop-off value), before re-initiating treatment with the same drug. Note: A patient must not have purchased any other drug in the previous six months (or chosen drop-off value). |
Note:
- Patient Dynamics use patient episodes (or dispensing behaviour) and not the absolute number of patients. One patient may be included in multiple categories; for example, if a patient's last script was more than six months ago (for chosen drop-off value) and has therefore ‘dropped-off’ but then recommenced the selected drug, prior to the data end date their next purchase will be defined as a ‘re-initiation’.
- If a patient purchased multiple scripts for the same drug in the same month, they are only counted once.
What does this report show you?
You can identify the source and loss of patients or business (over time) for:
- your drug
- a competitor drug
- a particular class of drug
- a particular line of treatment
- a particular demographic – sex, age, location
- a particular procedure or test (dependent on region and available data set)
- a particular diagnoses
What does this report show you?
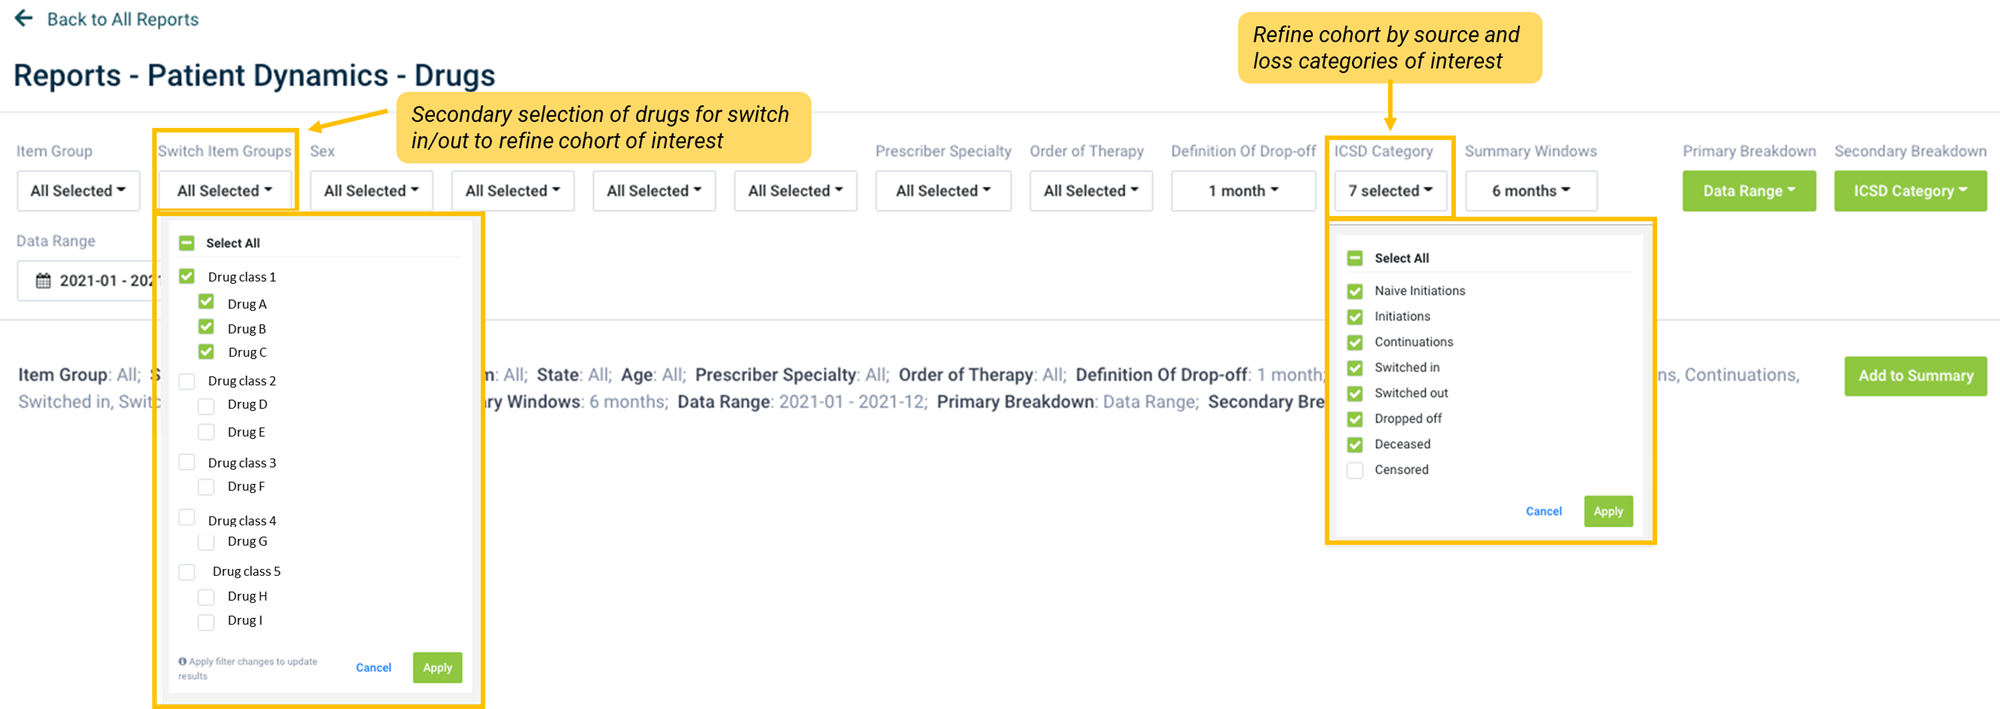
Report filters
The filters allow you to explore the data by patient demographics, the source and loss of patients (i.e. initiations, continuation, switch in/out or discontinuation) and time period.
- You can look at the market as a whole or focus on drugs that patients have switched in from or switched out to via the Switch Item Group filter.
- Use the ICSD Category to include or exclude specific patient source and loss categories (initiations, continuations, switches and discontinuations) lets you determine the drivers of patient inflow or outflow.
Breakdown
Use the Breakdown buttons to explore different segments of the data by other variables. You can modify the chart by selecting the base data (Primary breakdown, or x-axis) and the variables you want to view the data by, like age, sex or location (the Secondary breakdown).
Display options
You can configure the view of your data by changing the chart type, display data and data metrics or, applying smoothing.
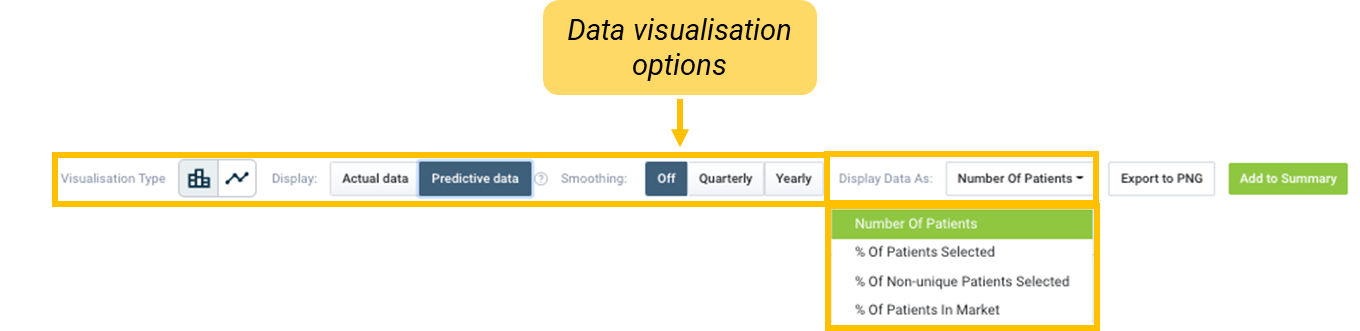
- You can select the preferred chart type, either stacked bar or line chart. Depending on the data you are exploring and the question to be answered, changing the chart type may assist in visualising comparisons.
- Display allows you to view 'Actual Data ' or ‘Modeled Data’ in the chart and table.
- Applying smoothing to the data will smooth out the trend over time (moving quarterly or yearly average).
- You can select the metric you want to view your data, by selecting an option from Display data as dropdown.