The report offers a precise overview of the number of prescribed services in Australia for a given month. It is based on a secondary dataset from Service Australia which provides 100% coverage for claims in a selected period. (The longitudinal patient data used for other Prospection reports for Australia is based on a 10% sample of PBS data.)
How can this report be used?
The PBS services report could be used to:
- see the exact number of claims in a period in order to gain a more precise picture of overall market share
- get an early view into the general trend of medication usage in the market given that the data for this report is available 1-2 months ahead of the PBS 10% dataset.
- compare service volumes between your drug and that of your competitors so you can make informed decisions and stay ahead of the competition.
- predict surges in medicine use by looking at seasonal trends.
How is this report calculated?
The PBS Services report counts the number of PBS services dispensed for each drug.
What does this report show you?
- your drug
- a competitor drug
- a particular class of drug
How can you modify the chart?
The filters above the chart (report filters) allow you to explore the data by parameters such as state and scheme.
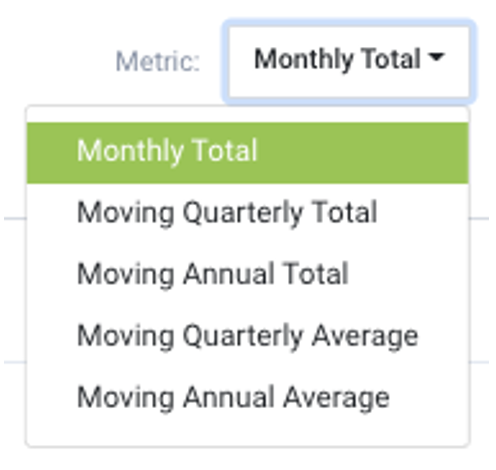
Metric
You can choose a metric breakdown to display either the moving average (smoothing) or moving total (such as a rolling quarterly or yearly sum of the data). More information on this feature can be found here.
Display data as
You can select the metric you want to use to view your data by selecting an option from the Display Data As dropdown list.
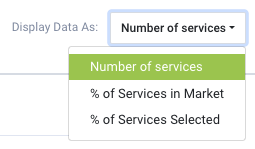
The report includes the following metrics:
- Number of services: The number of services dispensed for the selected item group.
- % of Services in Market: The percentage of services dispensed in relation to the entire market. The market comprises all services dispensed for drugs listed in the Item group filter.
- % of Services Selected: The percentage of services dispensed compared to the defined cohort, which includes the drug/s selected in the item group filter. If only one drug is selected, it will have 100% of the market share.
How does this report compare to the Medication counts report?
The PBS Services report differs from the Medication counts report in that it uses total aggregate numbers obtained directly from Service Australia, whereas the latter uses the PBS 10% dataset which is scaled to make it representative of the population. The information provided in the PBS Services report is based exclusively on PBS Item codes, which means that it does not allow for any longitudinal patient analysis or contain any patient demographic data (such as age and sex) or other patient level information.
